How to Fix Core Web Vitals: Step-by-Step Technical Optimization Guide
In today’s highly competitive digital landscape, having a visually appealing website is simply not enough. Search engines and users alike demand speed, stability, and seamless interactivity. As Muhin Ahmed, leading the technical strategies at Digital Solution IT, I have witnessed countless websites struggle to rank simply because their technical foundation was lacking.
Whether you are optimizing a local business site or a massive e-commerce platform, mastering technical SEO is non-negotiable. If you want to future-proof your website for Answer Engine Optimization (AEO) and Generative Engine Optimization (GEO), you must build an infrastructure that search engine crawlers and AI models can easily parse. This begins with Google’s most critical performance metrics.
In this comprehensive guide, we will walk through exactly how to fix Core Web Vitals, improve LCP, fix CLS, and reduce TTFB, ensuring your site dominates the SERPs.
Core Web Vitals Overview
What Are Core Web Vitals?
Core Web Vitals (CWV) are a set of specific, standardized metrics introduced by Google to measure the real-world user experience of a webpage. Unlike traditional vanity metrics, CWV focuses on three primary pillars of user experience: loading performance, visual stability, and interactivity. Google uses these signals to determine whether a user will have a smooth, frictionless experience when they click on your link from the search results.
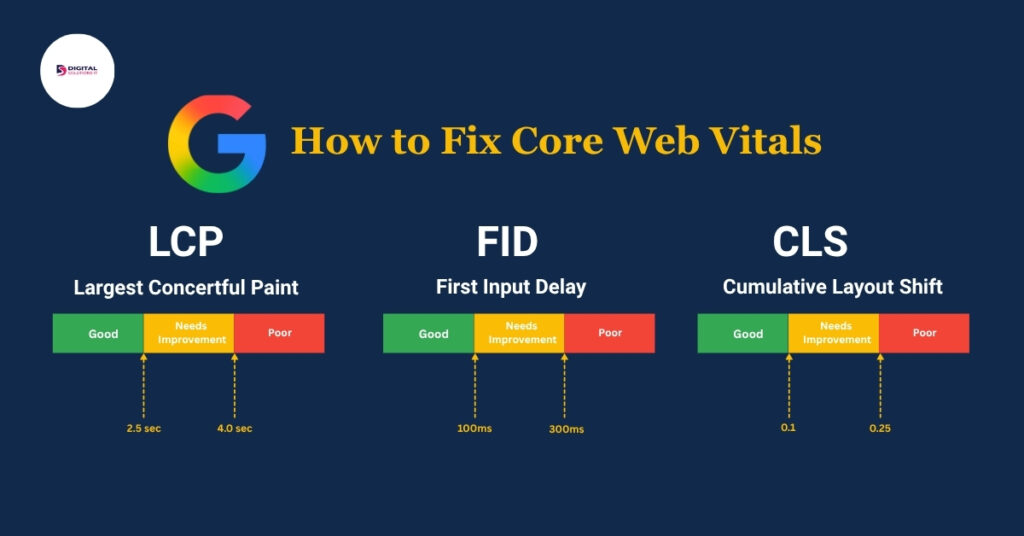
The three main components are:
- Largest Contentful Paint (LCP): Measures how long it takes for the largest piece of content (image or text block) to appear on the screen.
- First Input Delay (FID) / Interaction to Next Paint (INP): Measures the time it takes for a page to respond to a user’s first interaction. (Note: Google is transitioning from FID to INP to better measure overall page responsiveness).
- Cumulative Layout Shift (CLS): Measures the visual stability of a page, specifically how much the layout shifts unexpectedly as it loads.
Core Web Vitals and Page Experience Signals
Core Web Vitals do not exist in a vacuum; they are part of a broader set of Page Experience Signals evaluated by Google algorithms. These signals include mobile-friendliness, HTTPS security, and the absence of intrusive interstitials (like annoying pop-ups).
When a search engine or an AI-driven Answer Engine evaluates your website, it looks at this entire cluster of signals. Semantic SEO relies on strong contextual connections between entities, but if your page experience is poor, search engines will hesitate to serve your content as a primary answer. By aligning your CWV with global standards, you provide a stable foundation for your semantic content to shine.
Why Core Web Vitals Matter for Website Performance
From my extensive experience working as an SEO Expert in Bangladesh, I can confidently say that ignoring Core Web Vitals directly impacts your bottom line. Slow loading times and layout shifts lead to high bounce rates, low dwell time, and poor conversion rates.
Furthermore, Google has explicitly stated that CWV is a ranking factor. In a scenario where two websites have equally high-quality, relevant content, the site with superior Core Web Vitals will rank higher. Optimizing these metrics ensures that you are capturing maximum organic traffic while providing a user experience that turns visitors into loyal customers.
Measuring Core Web Vitals
Before you can fix performance issues, you must accurately diagnose them. Blindly applying optimizations without data can lead to wasted effort and broken website layouts.
How to Check Core Web Vitals in Google Search Console
Google Search Console (GSC) is the single most important diagnostic tool for webmasters. It provides real-world field data (CrUX) based on actual Chrome users visiting your site.
Core Web Vitals report explained To access this, log into GSC, look at the left-hand menu under “Experience,” and click on “Core Web Vitals.” The report groups URLs by status (Poor, Needs Improvement, Good) and by metric type (e.g., LCP issue: longer than 2.5s). This overarching view is critical for prioritizing your workflow, allowing you to tackle templates or clusters of pages that share the same technical debt.
Mobile vs Desktop issues GSC separates data into Mobile and Desktop reports. Because Google utilizes mobile-first indexing, the mobile report is significantly more critical. Mobile devices often have slower processors and rely on unstable 3G/4G networks. Therefore, a page that passes desktop assessment might fail miserably on mobile. You must address mobile issues first.
Using PageSpeed Insights for Core Web Vitals Assessment
While GSC gives you the “what” and “where,” Google PageSpeed Insights (PSI) gives you the “how to fix it.”
Understanding performance score When you enter a URL into PSI, it generates a performance score out of 100. However, do not obsess solely over this top-level number. Focus on the “Discover what your real users are experiencing” section (Field Data) versus the “Diagnose performance issues” section (Lab Data). Lab data is simulated, while field data is reality.
Opportunities and diagnostics Scroll down to the Opportunities section. This is your actionable roadmap. PSI will explicitly tell you to “Improve LCP,” “Fix CLS,” or “Reduce JavaScript execution time.” It highlights the exact images that are too large, the specific scripts blocking the main thread, and the exact DOM elements causing layout shifts.
Fixing Largest Contentful Paint (LCP)
What Is Largest Contentful Paint (LCP)?
Largest Contentful Paint measures the exact time it takes for the largest visual element in the user’s viewport to become fully visible. This element is usually a hero image, a video poster, or an H1 text block. For an optimal user experience, your LCP should occur within 2.5 seconds of the page first starting to load.
Common Causes of Poor LCP
Slow server If the browser takes too long to receive the initial HTML document from your server, everything else is delayed. This is heavily tied to Time to First Byte (TTFB).
Large images Unoptimized, high-resolution hero images are the #1 culprit for poor LCP. If a massive 3MB PNG file is placed at the top of your page, the LCP will invariably fail.
Render-blocking resources CSS and JavaScript files that must be downloaded and parsed before the browser can render the visible content are known as render-blocking resources. They essentially pause the loading of your LCP element.
How to Improve LCP
Image optimization To effectively improve LCP, convert your images to next-generation formats like WebP or AVIF. Compress them using tools like ShortPixel or Smush, and ensure you are serving properly scaled images (don’t serve a 2000px image for a 400px mobile container).
CDN usage A Content Delivery Network (CDN) like Cloudflare stores copies of your website’s static assets on servers distributed globally. This means a user in London downloads images from a UK server, rather than your origin server in another continent, drastically reducing load time.
Lazy loading Implement lazy loading for all images below the fold. However, never lazy load your LCP image (the hero image). Lazy loading delays the image request, which will destroy your LCP score.
Preload key resources Use the <link rel=”preload”> tag in your <head> to tell the browser to prioritize fetching your LCP image or critical web fonts immediately, before it even finishes parsing the HTML.
Fixing First Input Delay (FID)
What Is First Input Delay?
FID measures responsiveness. It calculates the time from when a user first interacts with your page (e.g., clicking a link, tapping a button) to the time when the browser is actually able to begin processing event handlers in response to that interaction. A good FID is under 100 milliseconds.
How to Reduce JavaScript Execution Time
The primary cause of poor FID is heavy JavaScript execution. When the browser’s main thread is busy executing complex JS code, it cannot respond to user clicks. To fix this, you must:
- Minify and compress JavaScript files.
- Defer non-critical JavaScript using the defer or async attributes.
- Remove unused third-party scripts.
Improve Browser Responsiveness
Break up Long Tasks. Any piece of JavaScript that blocks the main thread for more than 50ms is a “Long Task.” By breaking these tasks into smaller, asynchronous chunks, the browser can pause, respond to user input, and then resume processing.
Fixing Cumulative Layout Shift (CLS)
What Is CLS?
Cumulative Layout Shift is a measure of visual stability. It calculates the total sum of all unexpected layout shifts that occur during the entire lifespan of a page. Have you ever gone to click a button, only for the page to jump, causing you to click an ad instead? That is a poor CLS experience. A good CLS score is 0.1 or less.
Common CLS Issues
Missing image dimensions If you do not specify the width and height attributes in your image tags, the browser doesn’t know how much space to reserve. When the image finally downloads, it pushes all the text down, causing a massive layout shift.
Ads and embeds Dynamically injected content like Google AdSense banners, embedded tweets, or YouTube videos often load late and resize their containers abruptly.
Dynamic content Notification banners, newsletter pop-ups, or GDPR consent forms that inject themselves at the top of the DOM push the entire page structure down.
How to Fix CLS
Set width and height Always include native width and height attributes in your HTML for images and videos: <img src=”image.webp” width=”800″ height=”400″ alt=”example”>. The browser will use this aspect ratio to reserve the exact space required.
Reserve ad space If you are running ads, create a static <div> container with a fixed height and width to house the ad. Even if the ad loads slowly or fails to load, the space remains locked, preventing any layout shift.
Font display strategy Custom fonts can cause a Flash of Unstyled Text (FOUT) or a Flash of Invisible Text (FOIT), which changes the layout when the custom font renders. Use font-display: swap; in your CSS to ensure text remains visible during webfont load, and utilize font fallback stacks that match the dimensions of your custom font.
Optimizing TTFB and Server Performance
What Is Time to First Byte (TTFB)?
TTFB measures the time it takes for a user’s browser to receive the very first byte of data from your server after making an HTTP request. If your TTFB is slow, every other Core Web Vital (LCP, FCP) will suffer. A healthy TTFB is under 200 milliseconds.
Measure and Optimize TTFB
Server upgrade At Digital Solution IT, we always tell our clients: you cannot fix bad hosting with good code. If you are on a cheap, overcrowded shared server, your TTFB will fluctuate wildly. Upgrading to a VPS, Cloud Hosting, or a dedicated environment is often the fastest way to reduce TTFB.
Caching strategy Implement robust server-side caching (like Redis or Memcached) and page caching. When a page is cached, the server does not need to query the database and render PHP dynamically for every single visitor; it simply serves a pre-built static HTML file instantly.
Database optimization Over time, databases become bloated with revisions, spam comments, and transient data. Regularly clean your database and ensure proper indexing. Complex, slow database queries are a massive bottleneck for server response times.
Advanced Core Web Vitals Optimization Checklist
Technical SEO + Core Web Vitals Strategy
To truly dominate, you must integrate CWV into your broader Semantic SEO strategy. Fast-loading, stable pages enhance the crawler’s ability to index your entity-rich content efficiently.
- Audit all CSS and JS payloads.
- Implement Critical CSS (inlining CSS needed for above-the-fold content).
- Ensure rigorous PageSpeed Insights optimization for both staging and production environments.
Continuous Monitoring Plan
Core Web Vitals are not a “set it and forget it” task. As you add new plugins, change themes, or upload new content, your scores will fluctuate. Set up automated API pulls from Google Search Console or use tools like Screaming Frog to monitor your performance metrics monthly.
Common Mistakes to Avoid
- Installing too many plugins: Each plugin adds server load and potentially render-blocking JS.
- Ignoring third-party scripts: Chatbots, tracking pixels, and heavy analytics tools destroy mobile performance. Use Google Tag Manager to delay their firing.
- Forgetting about the DOM size: A deeply nested HTML structure (too many div tags) forces the browser to consume excessive memory. Keep your DOM tree clean and shallow.
As an experienced SEO Expert in Bangladesh, I always advise clients that a clean, well-coded foundation is the best marketing investment you can make. When you build a site that users love navigating, Google will naturally reward you with higher rankings. If you need dedicated, hands-on assistance, partnering with a technical SEO Agency in Sylhet BD like Digital Solution IT ensures your website stays ahead of algorithm updates.
FAQ
Q1: How to solve the Core Web Vitals issue?
To solve Core Web Vitals issues, you must identify the specific failing metric in Google Search Console. If LCP is failing, optimize server speed and compress hero images. If CLS is failing, set fixed dimensions for images and ads. If FID is failing, minimize and defer JavaScript execution. Systematic debugging using PageSpeed Insights is the key.
Q2: How to fix core web vitals?
Fixing Core Web Vitals requires a multi-step technical approach: upgrade your hosting server, implement a CDN, enable page caching, convert images to WebP format, utilize lazy loading for below-the-fold content, and inline critical CSS. Applying these technical adjustments will dramatically improve your scores.
Q3: What are CLS and LCP in Google Search Console?
In Google Search Console, LCP (Largest Contentful Paint) indicates the loading speed of the largest visual element on the screen. CLS (Cumulative Layout Shift) measures the visual stability of the page, indicating how much the elements shift around while the page is loading. Both are primary ranking factors under the Page Experience update.
Q4: Why are core web vitals important for SEO?
Core Web Vitals are important for SEO because Google uses them as direct ranking signals. They are quantitative measures of user experience. A website that loads fast, responds quickly to interactions, and remains visually stable provides a superior user experience, leading to higher engagement rates and better organic search placement.
Q5: Core Web Vitals Assessment by Google Page Speed?
The Core Web Vitals Assessment in Google PageSpeed Insights provides both Lab Data (simulated environment) and Field Data (real-world user experiences over the last 28 days). It offers a clear “Passed” or “Failed” assessment and provides a granular, prioritized list of technical opportunities to optimize your code and server.
Q6: What are the 3 core web vitals?
The three primary Core Web Vitals are:
- Largest Contentful Paint (LCP) – measures loading performance.
- First Input Delay (FID) / Interaction to Next Paint (INP) – measures interactivity and responsiveness.
- Cumulative Layout Shift (CLS) – measures visual stability.
Q7: What are core web vitals? Why is it important?
Core Web Vitals are a specific set of metrics created by Google to evaluate the real-world user experience of a webpage. They are critically important because they directly influence SEO rankings, impact conversion rates, reduce user bounce rates, and ensure your website is technically capable of surviving in an AI-driven, Answer Engine Optimized digital landscape.